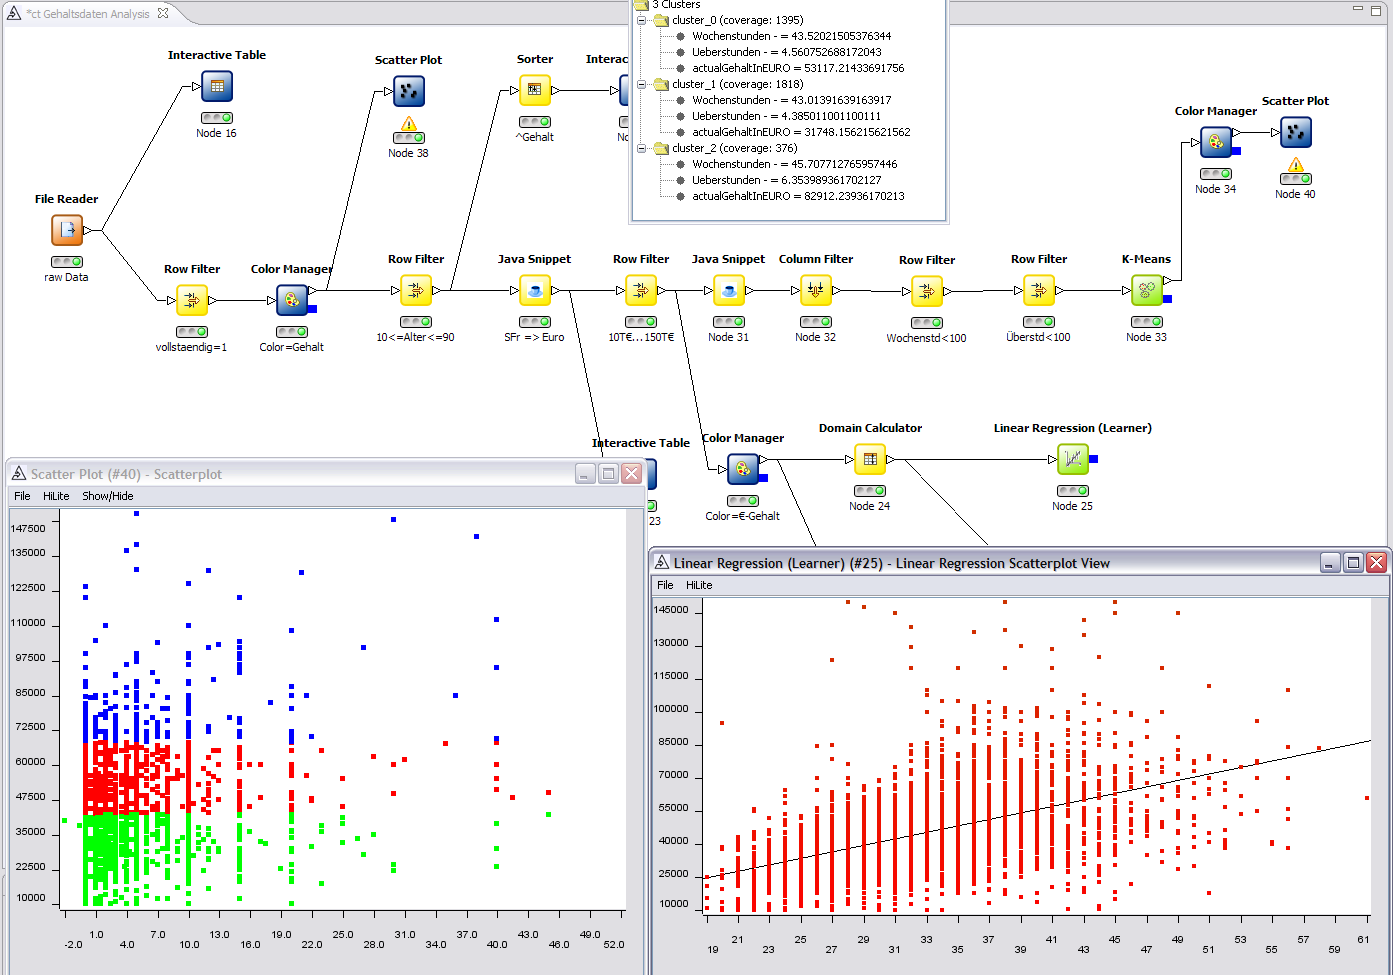
Open-source data visualization software for analytics
The importance of data visualization
In today’s data-driven world, the ability to visualize data effectively is crucial for businesses looking to make informed decisions. Data visualization software helps users understand complex data sets by presenting information in a visual format, making it easier to identify trends, patterns, and outliers. This can lead to more informed decision-making, improved communication, and ultimately, better business outcomes.
What is open-source data visualization software?
Open-source data visualization software is a type of software that allows users to access, modify, and distribute the source code for free. This means that users have the freedom to customize the software to meet their specific needs, without being restricted by licensing fees or proprietary restrictions. Open-source software is often developed collaboratively by a community of volunteers, who work together to improve the software and add new features over time.
Benefits of using open-source data visualization software

Image Source: website-files.com
There are several advantages to using open-source data visualization software for analytics. One of the main benefits is cost savings, as open-source software is typically free to use. This can be particularly beneficial for small businesses or organizations with limited budgets, who may not be able to afford expensive proprietary software. Additionally, open-source software is often more flexible and customizable than proprietary alternatives, allowing users to tailor the software to their specific needs.
Popular open-source data visualization software
There are many different open-source data visualization tools available on the market today. Some of the most popular options include:
– Apache Superset: A modern, enterprise-ready business intelligence web application
– Metabase: An easy-to-use data visualization tool that allows users to create charts, dashboards, and metrics
– Grafana: A powerful dashboarding and visualization tool that is commonly used for monitoring and analytics
– D3.js: A JavaScript library for manipulating documents based on data, allowing users to create interactive visualizations on the web
How to choose the right open-source data visualization software
When selecting an open-source data visualization software for analytics, it’s important to consider your specific needs and requirements. Some key factors to consider include:
– Ease of use: Is the software user-friendly and intuitive to use?
– Compatibility: Does the software support the data formats and sources you need?
– Customization: Can the software be easily customized to meet your specific requirements?
– Community support: Is there an active community of users and developers who can provide assistance and support?
Best practices for using open-source data visualization software

Image Source: cloudinary.com
To get the most out of your open-source data visualization software, it’s important to follow best practices when creating and using visualizations. Some tips to keep in mind include:
– Start with a clear goal in mind: Before creating a visualization, define the purpose and objective of the visualization
– Keep it simple: Avoid cluttering your visualizations with unnecessary elements, and focus on conveying the key insights
– Use appropriate visualization types: Choose the right type of visualization for your data, whether it’s a bar chart, line graph, or scatter plot
– Test and iterate: Don’t be afraid to experiment with different visualization options, and refine your visualizations based on feedback and insights
Case studies: Real-world examples of open-source data visualization in action
To illustrate the power and potential of open-source data visualization software, let’s explore some real-world examples of organizations using these tools to drive insights and decision-making:
– The New York Times: The media giant uses D3.js to create interactive visualizations for their online articles, helping readers better understand complex data
– Airbnb: The popular travel platform uses Apache Superset to analyze and visualize user data, enabling them to optimize their services and improve the user experience
– NASA: The space agency uses Grafana to monitor and analyze data from spacecraft, satellites, and other sources, helping them make critical decisions in real-time
Conclusion

Image Source: logz.io
In conclusion, open-source data visualization software is a powerful tool that can help businesses and organizations unlock valuable insights from their data. By leveraging open-source software, users can save costs, customize their tools, and collaborate with a vibrant community of developers. Whether you’re a small business looking to make smarter decisions or a large enterprise seeking to optimize your operations, open-source data visualization software can help you achieve your goals.
FAQs
1. What is the difference between open-source and proprietary data visualization software?
2. How can I contribute to the development of open-source data visualization tools?
3. Are there any limitations to using open-source data visualization software?
4. Can open-source data visualization software be integrated with other analytics tools?
5. What are some common challenges when using open-source data visualization software?
Open-source data visualization software for analytics